TalkCarswell.com
Douglas Carswell's Blog
24 MAY 2011
How that deficit reduction coming along?
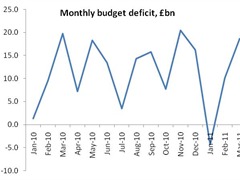 Further to my last graph, I see that for April, public sector net borrowing rose to £10 Billion.
I think that when the Swedes and the Canadians cut public spending in the 1990s, they took a different approach. They cut it. Across the board. No exceptions.
Perhaps its those exceptions - overseas aid increases, more money for Eurocrats, financing for flawed defence contracts, £1 Billion for Libya etc etc - which help keep the graph stubbornly high?
blog comments powered by Disqus
 RSS Feed
The End of Politics and the Birth of iDemocracy

"A revolutionary text ... right up there with the Communist manifesto" - Dominic Lawson, Sunday Times
Printed and promoted by Chris Lowe on behalf of Douglas Carswell, both of 105 Station Road, Clacton-on-Sea, Essex
