TalkCarswell.com
Douglas Carswell's Blog
Treasury policy unchanged?
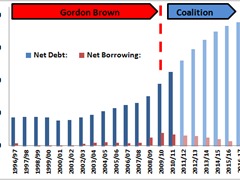 Here is a graph that shows Britain's net public net and net public borrowing over the twenty year period between 1997 and 2017. (Click on it to see an enlarged version)
What's the first thing you notice?
The Lion's share of the increase in net public debt is likely to happen under the Coalition. Net public debt took approximately a decade to double under Gordon Brown (from approximately £400 Billion to £800 Billion). It will take half that time to double again under the Coalition (from approximately £800 Billion to £1,600 Billion).
For all the talk of austerity, more public debt will have been accumulated much faster under the current administration than under the previous one.
Look more closely, and you will notice the thin red line at the bottom. That shows the size of the deficit, or the difference between what the government has as revenue and what it spends each year.
The deficit is due to come down. Eventually. But this graph helps put it into perspective against total public debt.
It is often suggested that the Coalition represents a radical break with what went before. In fact, if you look at the rate at which Britain continues to accumulate public debt, the trajectory has hardly changed at all.
If we are to escape from this tidal wave of debt, we need to grow our way out of it. That means simpler taxes, lower taxes, and supply side reform. But no growth strategy = no growth.
I fear that if we keep running the economy the way Gordon Brown did, we will end up where Mr Brown landed us.
blog comments powered by Disqus
 RSS Feed
The End of Politics and the Birth of iDemocracy

"A revolutionary text ... right up there with the Communist manifesto" - Dominic Lawson, Sunday Times
Printed and promoted by Chris Lowe on behalf of Douglas Carswell, both of 105 Station Road, Clacton-on-Sea, Essex
